撒哈拉以南非洲
位於撒哈拉沙漠以南的非洲大陸地區
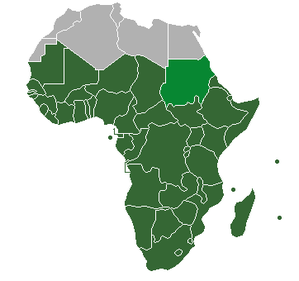
撒哈拉以南非洲[2](英語:Sub-Saharan Africa),指撒哈拉沙漠以南的非洲地區,又稱亞撒哈拉地區、下撒哈拉、漠南非洲、南非,也有稱黑非洲(Negro Africa)。自然地理上與衣索比亞界高度重疊。政治上,包括了所有或部分领土位于撒哈拉沙漠以南的国家(苏丹除外,尽管其位于撒哈拉沙漠的东缘)。与这一概念相对应的是北部非洲,其通常被认为是阿拉伯世界的一部分。索马里、吉布提、科摩罗和毛里塔尼亚地理上属于撒哈拉以南非洲,但也是阿拉伯世界的一部分。

浅绿:联合国认为
 苏丹属于北部非洲[1]
地理编辑
本地區面積約2430万平方公里。從公元前三千五百多年起,雖然撒哈拉沙漠以其人煙稀疏與天候惡劣,一直成為北非及本地區間的天然障礙,但亦有尼羅河及紅海可以交通撒哈拉沙漠以北的埃及與撒哈拉沙漠以南的東非地區,另外古代還有跨撒哈拉貿易可以交通北非地中海沿岸與西非內陸地區。
西非馬里統治者曼薩·穆薩就曾經親自跨越撒哈拉沙漠,途經開羅前往麥加朝聖。
人口编辑


根据联合国《世界人口展望(2019)》[3][4],2019年撒哈拉以南非洲人口为11亿。目前的增长率为2.3%。联合国预测,到2050年该地区人口将达到20亿至25亿[5] ,人口密度为每平方千米80人。与之相比,届时西欧、亚洲和美洲的人口密度将分别为每平方公里170人、140人和30人。
撒哈拉以南非洲国家在生育率最高的50个国家和地区中占40个,2008年总和生育率均大于4。除南非和塞舌尔外,其他国家均高于世界平均水平[6]。 除南非以外的撒哈拉以南国家(亦包括苏丹),其中40%以上的人口年龄在15岁以下。[7]
| 國家 | 人口 | 面積 | 識字率(男/女)[8] | 人均GDP[8] | 清廉指數(排名/分數)[9] | 預期壽命[8] | HDI | EODBR/SAB[10] | PFI[11](排名/分數) |
|---|---|---|---|---|---|---|---|---|---|
 安哥拉 安哥拉 | 18,498,000 | 1,246,700 | 82.9%/54.2% | 6,800 | 168/2 | 42.4 | 0.486 | 172/171 | 132/58,43 |
 布隆迪 布隆迪 | 8,988,091 | 27,830 | 67.3%/52.2% | 700 | 168/1.8 | 49 | 0.316 | 176/130 | 103/29,00 |
 刚果民主共和国 刚果民主共和国 | 68,692,542 | 2,345,410 | 80.9%/54.1% | 800 | 162/11.9 | 46.1 | 0.286 | 182/152 | 146/53,50 |
 喀麦隆 喀麦隆 | 18,879,301 | 475,440 | 77%/59.8% | 3,700 | 146/2.2 | 50.3 | 0.482 | 171/174 | 109/30,50 |
 中非 中非 | 4,511,488 | 622,984 | 64.8%/33.5% | 700 | 158/2.8 | 44.4 | 0.343 | 183/159 | 80/17,75 |
 乍得 乍得 | 10,329,208 | 1,284,000 | 40.8%/12.8% | 2,300 | 175/1.6 | 50.6 | 0.328 | 178/182 | 132/44,50 |
 刚果共和国 刚果共和国 | 3,700,000 | 342,000 | 90.5%/ 79.0% | 800 | 162/1.9 | 54.8 | 0.533 | N/A | 116/34,25 |
 赤道几内亚 赤道几内亚 | 1,110,000 | 28,051 | 93.4%/80.3% | 37,400 | 168/1.8 | 51.1 | 0.537 | 170/178 | 158/65,50 |
 加彭 加彭 | 1,514,993 | 267,667 | 88.5%/79.7% | 18,100 | 106/2.9 | 56.7 | 0.674 | 158/152 | 129/43,50 |
 肯尼亚 肯尼亚 | 39,002,772 | 582,650 | 77.7%/70.2 | 3,500 | 146/2.2 | 57.8 | 0.519 | 95/124 | 96/25,00 |
 奈及利亞 奈及利亞 | 174,507,539 | 923,768 | 84.4%/72.7%[12] | 5,900 | 136/2.7 | 57 | 0.504 | 131/120 | 112/34.24 |
 卢旺达 卢旺达 | 10,473,282 | 26,338 | 71.4%/59.8% | 2,100 | 89/3.3 | 46.8 | 0.429 | 67/11 | 157/64,67 |
 聖多美和普林西比 聖多美和普林西比 | 212,679 | 1,001 | 92.2%/77.9% | 3,200 | 111/2.8 | 65.2 | 0.509 | 180/140 | NA |
 坦桑尼亚 坦桑尼亚 | 44,928,923 | 945,087 | 77.5%/62.2% | 3,200 | 126/2.6 | 51.9 | 0.466 | 131/120 | NA/15,50 |
 乌干达 乌干达 | 32,369,558 | 236,040 | 76.8%/57.7 | 2,400 | 130/2.5 | 50.7 | 0.446 | 112/129 | 86/21,50 |
 苏丹 苏丹 | 31,894,000 | 1,886,068 | 79.6%/60.8% | 4,300 | 176/1.5 | 62.57[13] | 0.408 | 154/118 | 148/54,00 |
 南蘇丹 南蘇丹 | 8,260,490 | 619,745 | 1,600 | ||||||
 吉布提 吉布提 | 516,055 | 23,000 | N/A | 3,600 | 111/2.8 | 54.5 | 0.430 | 163/177 | 110/31,00 |
 厄立特里亚 厄立特里亚 | 5,647,168 | 121,320 | N/A | 1,600 | 126/2.6 | 57.3 | 0.349 | 175/181 | 175/115,50 |
 衣索比亞 衣索比亞 | 85,237,338 | 1,127,127 | 50%/28.8% | 2,200 | 120/2.7 | 52.5 | 0.363 | 107/93 | 140/49,00 |
 索马里 索马里 | 9,832,017 | 637,657 | N/A | N/A | 180/1.1 | 47.7 | N/A | N/A | 164/77,50 |
 博茨瓦纳 博茨瓦纳 | 1,990,876 | 600,370 | 80.4%/81.8% | 17,000 | 37/5.6 | 49.8 | 0.633 | 45/83 | 62/15,50 |
 科摩罗 科摩罗 | 752,438 | 2,170 | N/A | 1,600 | 143/2.3 | 63.2 | 0.433 | 162/168 | 82/19,00 |
 賴索托 賴索托 | 2,130,819 | 30,355 | 73.7%/90.3% | 3,300 | 89/3.3 | 42.9 | 0.450 | 130/131 | 99/27,50 |
 马达加斯加 马达加斯加 | 19,625,000 | 587,041 | 76.5%/65.3% | 1,600 | 99/3.0 | 59 | 0.480 | 134/12 | 134/45,83 |
 马拉维 马拉维 | 14,268,711 | 118,480 | N/A | 1,200 | 89/3.3 | 47.6 | 0.400 | 132/128 | 62/15,50 |
 模里西斯 模里西斯 | 1,284,264 | 2,040 | 88.2%/80.5% | 22,300 | 42/5.4 | 73.2 | 0.728 | 17/10 | 51/14,00 |
 莫桑比克 莫桑比克 | 21,669,278 | 801,590 | N/A | 1,300 | 130/2.5 | 42.5 | 0.322 | 135/96 | 82/19,00 |
 纳米比亚 纳米比亚 | 2,108,665 | 825,418 | 86.8%/83.6% | 11,200 | 56/4.5 | 52.5 | 0.625 | 66/123 | 35/9,00 |
 塞舌尔 塞舌尔 | 87,476 | 455 | 91.4%/92.3% | 29,300 | 54/4.8 | 72.2 | 0.773 | 111/81 | 72/16,00 |
 南非 南非 | 59,899,991 | 1,219,912 | N/A | 13,600 | 55/4.7 | 50.7 | 0.619 | 34/67 | 33/8,50 |
 斯威士兰 斯威士兰 | 1,123,913 | 17,363 | 80.9%/78.3% | 11,089 | 79/3.6 | 40.8 | 0.608 | 115/158 | 144/52,50 |
 尚比亞 尚比亞 | 11,862,740 | 752,614 | N/A | 4,000 | 99/3.0 | 41.7 | 0.430 | 90/94 | 97/26,75 |
 辛巴威 辛巴威 | 11,392,629 | 390,580 | 92.7%/86.2% | 2,300 | 146/2.2 | 42.7 | 0.376 | 159/155 | 136/46,50 |
 贝宁 贝宁 | 8,791,832 | 112,620 | 47.9%/42.3% | 2,300 | 106/2.9 | 56.2 | 0.427 | 172/155 | 97/26,75 |
 马里 马里 | 12,666,987 | 1,240,000 | 32.7%/15.9% | 2,200 | 111/2.8 | 53.8 | 0.359 | 156/139 | 38/8,00 |
 布吉納法索 布吉納法索 | 15,730,977 | 274,200 | 25.3% | 1,900 | 79/3.6 | 51 | 0.331 | 150/116 | N/A |
 佛得角 佛得角 | 499,000 | 322,462 | 7,000 | ||||||
 科特迪瓦 科特迪瓦 | 20,617,068 | 322,463 | 3,900 | ||||||
 冈比亚 冈比亚 | 1,782,893 | 11,295 | 2,600 | ||||||
 加纳 加纳 | 24,200,000 | 238,535 | 4,700 | ||||||
 几内亚 几内亚 | 10,057,975 | 245,857 | 2,200 | ||||||
 几内亚比绍 几内亚比绍 | 1,647,000 | 36,125 | 1,900 | ||||||
 利比里亚 利比里亚 | 4,128,572 | 111,369 | 1,300 | ||||||
 毛里塔尼亚 毛里塔尼亚 | 3,359,185 | 1,030,700 | 4,500 | ||||||
 尼日尔 尼日尔 | 17,129,076 | 1,267,000 | 1,200 | ||||||
 塞内加尔 塞内加尔 | 12,855,153 | 196,712 | 3,500 | ||||||
 塞拉利昂 塞拉利昂 | 6,190,280 | 71,740 | 1,600 | ||||||
 多哥 多哥 | 7,154,237 | 56,785 | 1,700 |
GDP per Capita (PPP) (2016, 2017 (PPP, US$)), Life (Exp.) (Life Expectancy 2006), Literacy (Male/Female 2006), Trans (Transparency 2009), HDI (Human Development Index), EODBR (Ease of Doing Business Rank June 2008 through May 2009), SAB (Starting a Business June 2008 through May 2009), PFI (Press Freedom Index 2009)
參考文獻编辑
- ^ Composition of macro geographical (continental) regions, geographical sub-regions, and selected economic and other groupings. United Nations Statistics Division. 11 February 2013 [20 July 2013]. (原始内容存档于2010-04-17). "The designation sub-Saharan Africa is commonly used to indicate all of Africa except Northern Africa, with the Sudan included in sub-Saharan Africa."
- ^ sub-Saharan Africa. [2015-08-22]. (原始内容存档于2016-03-05).
- ^ "World Population prospects – Population division". population.un.org. United Nations Department of Economic and Social Affairs. Population Division. [2019-11-09].
- ^ "Overall total population" – World Population Prospects: The 2019 Revision (xslx). population.un.org (custom data acquired via website). United Nations Department of Economic and Social Affairs. Population Division. [2019-11-09].
- ^ World Population Prospects 2019 – Population Division. Esa.un.org. 28 August 2019 [22 December 2019]. (原始内容存档于15 June 2020).
- ^ Fertility rate, total (births per woman) | Data. data.worldbank.org. [21 July 2016]. (原始内容存档于8 July 2016).
- ^ According to the CIA Factbook Archive.is的存檔,存档日期5 August 2012: Angola, Benin, Burundi, Burkina Faso, the Central African Republic, Cameroon, Chad, the Republic of Congo, the Democratic Republic of Congo, Djibouti, Equatorial Guinea, Eritrea, Ethiopia, Gabon, the Gambia, Ghana, Guinea, Guinea-Bissau, Kenya, Liberia, Madagascar, Malawi, Mali, Mauritania, Mozambique, Namibia, Nigeria, Rwanda, Senegal, Sierra Leone, Somalia, Sudan, Swaziland, Tanzania, Togo, Uganda, and Zambia
- ^ 8.0 8.1 8.2 (2009). Africa Development Indicators 2008/2009: From the World Bank Africa Database AFRICAN DEVELOPMENT INDICATORS. World Bank Publications, p. 28, ISBN 0-8213-7787-6, 9780821377871.
- ^ Transparency International. Corruption Perception Index (CPI) 2009 (页面存档备份,存于互联网档案馆).
- ^ World Bank. Doing Business 2010, Economy Ranking 互联网档案馆的存檔,存档日期7 January 2010.
- ^ [1]
- ^ National Literacy Survey. National Bureau of Statistics. June 2010 [5 September 2015]. (原始内容存档于17 September 2015).
- ^ The World Factbook. Cia.gov. [29 September 2015]. (原始内容存档于28 May 2014).

