File:USDebt.png
本预览的尺寸:444 × 599像素。 其他分辨率:178 × 240像素 | 356 × 480像素 | 744 × 1,004像素。
原始文件 (744 × 1,004像素,文件大小:53 KB,MIME类型:image/png)
 | File:USdebt.svg是此文件的矢量版本。 如果此文件质量不低于原点阵图,就应该将这个PNG格式文件替换为此文件。 File:USDebt.png → File:USdebt.svg 更多信息请参阅Help:SVG/zh。 |  |
摘要
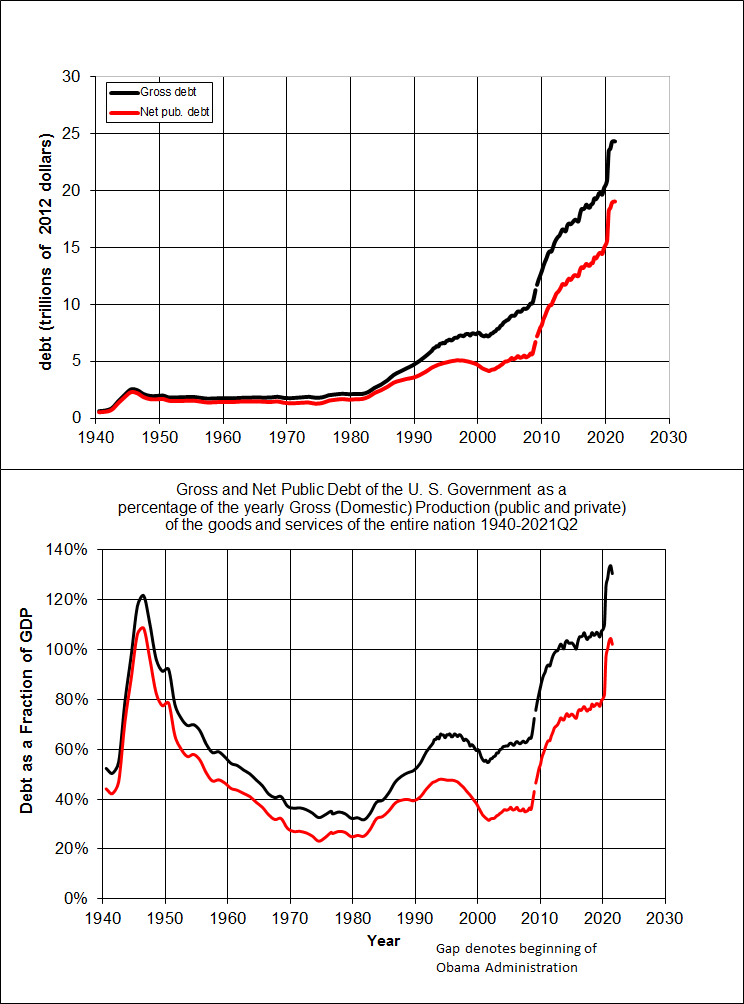
| 描述 | U.S. debt from 1940 to 2010. Red lines indicate the Debt Held by the Public (net public debt) and black lines indicate the Total Public Debt Outstanding (gross public debt), the difference being that the gross debt includes that held by the federal government itself. The second panel shows the two debt figures as a percentage of U.S. GDP (dollar value of U.S. economic production for that year). The top panel is deflated so every year is in 2010 dollars. |
| 日期 | |
| 来源 | United States Government Originally uploaded by O18 (talk) to en:Wikipedia (log). |
| 作者 | en:User:O18 |
| 授权 (二次使用本文件) | 本文件采用知识共享署名-相同方式共享 3.0 未本地化版本许可协议授权。
|
Data sources
Data for 1940-2010 are available from the United States Government at http://www.whitehouse.gov/omb/budget/Historicals archive copy at the Wayback Machine
- Debt (nominal and percentage of GDP): table 7.1
- Deflator (composite outlay deflator): table 1.3 or 10.1
Table description:
- year: fiscal year
- gross federal debt dollars: (nominal) gross federal debt (millions)
- total public dollars: (nominal) federal debt held by the public, ie, net of that held by federal govt (millions)
- deflator: composite outlay deflator (indexed to 2005)
- gross federal debt gdp: gross federal debt over fiscal year GDP (on same nominal/real basis)
- total public gdp: federal debt held by the public over fiscal year GDP (on same nominal/real basis)
Evidence against bias:
- the gross federal debt dollars series agrees well with the Oct, 23 AP report ("U.S. Debt Past $1 Trillion") that the debt first passed 1 Trillion dollars that day.
- The gross federal debt gdp in 2007 is the ratio of the nominal GDP from CIA fact book in 2007 over the nominal debt from table 7.1 in the reference.
Tabled data
This data tabled directly from the source (Presidents FY2012 budget). Note: deflators are applied when graphing in the code below, and it is deflated to the stated year (now 2010).
"year","gross.federal.debt.dollars","total.public.dollars","deflator","gross.federal.debt.gdp","total.public.gdp"1940,50696,42772,0.0804,52.4,44.21941,57531,48223,0.0836,50.4,42.31942,79200,67753,0.0936,54.9,47.01943,142648,127766,0.1026,79.1,70.91944,204079,184796,0.0949,97.6,88.31945,260123,235182,0.0905,117.5,106.21946,270991,241861,0.0906,121.7,108.61947,257149,224339,0.1000,110.3,96.21948,252031,216270,0.1058,98.4,84.51949,252610,214322,0.1024,93.2,79.11950,256853,219023,0.1064,94.1,80.21951,255288,214326,0.1047,79.6,66.91952,259097,214758,0.1041,74.3,61.61953,265963,218383,0.1124,71.3,58.61954,270812,224499,0.1163,71.8,59.51955,274366,226616,0.1203,69.5,57.41956,272693,222156,0.1263,63.8,52.01957,272252,219320,0.1327,60.5,48.71958,279666,226336,0.1405,60.7,49.21959,287465,234701,0.1460,58.5,47.81960,290525,236840,0.1466,56.1,45.71961,292648,238357,0.1507,55.1,44.91962,302928,248010,0.1511,53.4,43.71963,310324,253978,0.1579,51.8,42.41964,316059,256849,0.1599,49.4,40.11965,322318,260778,0.1620,46.9,38.01966,328498,263714,0.1658,43.6,35.01967,340445,266626,0.1700,41.9,32.81968,368685,289545,0.1765,42.5,33.41969,365769,278108,0.1881,38.6,29.31970,380921,283198,0.1991,37.6,28.01971,408176,303037,0.2133,37.8,28.11972,435936,322377,0.2283,37.0,27.41973,466291,340910,0.2412,35.7,26.11974,483893,343699,0.2621,33.6,23.91975,541925,394700,0.2889,34.7,25.31976,628970,477404,0.3117,36.2,27.51977,706398,549104,0.3371,35.8,27.81978,776602,607126,0.3588,35.0,27.41979,829467,640306,0.3902,33.2,25.61980,909041,711923,0.4318,33.3,26.11981,994828,789410,0.4789,32.6,25.81982,1137315,924575,0.5136,35.2,28.61983,1371660,1137268,0.5393,39.9,33.11984,1564586,1306975,0.5675,40.7,34.01985,1817423,1507260,0.5868,43.9,36.41986,2120501,1740623,0.6020,48.1,39.51987,2345956,1889753,0.6210,50.5,40.61988,2601104,2051616,0.6398,51.9,41.01989,2867800,2190716,0.6634,53.1,40.61990,3206290,2411558,0.6840,55.9,42.11991,3598178,2688999,0.7162,60.7,45.31992,4001787,2999737,0.7436,64.1,48.11993,4351044,3248396,0.7637,66.1,49.31994,4643307,3433065,0.7780,66.6,49.21995,4920586,3604378,0.7992,67.0,49.11996,5181465,3734073,0.8184,67.1,48.41997,5369206,3772344,0.8356,65.4,45.91998,5478189,3721099,0.8436,63.2,43.01999,5605523,3632363,0.8554,60.9,39.42000,5628700,3409804,0.8767,57.3,34.72001,5769881,3319615,0.8988,56.4,32.52002,6198401,3540427,0.9135,58.8,33.62003,6760014,3913443,0.9375,61.6,35.62004,7354673,4295544,0.9644,62.9,36.82005,7905316,4592229,1.0000,63.6,36.92006,8451350,4828972,1.0354,64.0,36.62007,8950744,5035129,1.0642,64.6,36.32008,9986082,5803050,1.1031,69.7,40.52009,11875851,7544707,1.1085,85.2,54.12010,13528807,9018941,1.1218,94.2,62.82011,14764222,10128206,1.1525,98.7,67.72012,16050921,11281131,1.175343,100.1,70.42013,16719434,11982713,1.190529,101.2,72.62014,17794483,12779899,1.208930,103.3,74.22015,18120106,13116692,1.216690,101.2,73.32016,19539445,14167725,1.226666,106.1,77.0
July 29, 2021 Comprehensive revision: debt from U.S. Treasury website, GDP and deflators from BEA table, Debt/GDP ratio calculated from foregoing
Program
The image was made with R using the following code after setting the working directory properly.
#setwd("~/") # <- you have to change this to a folder on your computerdat <- read.csv("debt.txt") # <- you have to put the above data as debt.txt in the folderbitmap(file="USDebt.png",type="png256",width=6,height=7,res=300,pointsize=14)par(mfrow=c(2,1))par(mar=c(2,3.5,0.1,1))par(las=1)par(yaxs="i")par(mgp=c(2.1,0.6,0))dat$deflator <- dat$deflator / dat$deflator[dat$year==2010]plot(range(dat$year),range(1.04 * c(0,dat$gross.federal.debt.dollars/dat$deflator/1e6)),type="n",xlab="debt",ylab="debt (trillions of 2010 dollars)",lwd=3)lines(dat$year,dat$gross.federal.debt.dollars/dat$deflator/1e6,lwd=3)lines(dat$year,dat$total.public.dollars/dat$deflator/1e6,type="l",col="red",lwd=3)legend("topleft",lwd=3,col=c("black","red"),legend=c("gross debt","public debt"),bty="n")par(mar=c(2,3.5,0.1,1))plot(range(dat$year),range(1.04 * c(0,dat$gross.federal.debt.gdp,dat$total.public.gdp)),type="n",xlab="year",ylab="debt as a % of gdp")lines(dat$year,dat$gross.federal.debt.gdp,type="l",lwd=3)lines(dat$year,dat$total.public.gdp,type="l",col="red",lwd=3)dev.off()文件历史
点击某个日期/时间查看对应时刻的文件。
| 日期/时间 | 缩略图 | 大小 | 用户 | 备注 | |
|---|---|---|---|---|---|
| 当前 | 2021年8月1日 (日) 22:19 | | 744 × 1,004(53 KB) | ResidentScholar | Updated to 2021Q2 with July 29, 2021 Bureau of Economic Analysis comprehensive update |
| 2017年6月27日 (二) 03:08 |  | 1,800 × 2,100(39 KB) | O18 | updated data | |
| 2012年4月5日 (四) 17:53 |  | 1,800 × 2,100(41 KB) | Pdbailey | ||
| 2011年3月14日 (一) 15:07 |  | 1,800 × 2,100(40 KB) | Pdbailey | ||
| 2011年3月14日 (一) 15:05 |  | 1,800 × 2,100(40 KB) | Pdbailey | ||
| 2011年2月26日 (六) 22:39 |  | 1,173 × 1,443(27 KB) | ResidentScholar~commonswiki | The previous version of this file had a legend saying 2009 deflator, but had data for a 2005 deflator. There was substantial inflation between 2005 and 2010, so the adjustment is quite noticeable: my point being that the price increases did not take pla | |
| 2010年3月31日 (三) 13:28 |  | 1,800 × 2,100(40 KB) | Pdbailey | ||
| 2010年3月30日 (二) 23:58 |  | 1,800 × 2,100(40 KB) | Pdbailey | ||
| 2009年9月23日 (三) 17:32 |  | 1,800 × 2,100(40 KB) | Pdbailey | Update to take comments into account | |
| 2009年6月19日 (五) 12:49 |  | 1,800 × 2,100(41 KB) | Nick Anfinsen | {{Information |Description===Data sources== Data for 1940-2007 are available from the United States Government * Debt (nominal and percentage of GDP): [http://www.whitehouse.gov/omb/budget/fy2009/pdf/hist.pdf], table 7.1 * Deflator (composite outlay defl |
文件用途
以下页面使用本文件:
全域文件用途
以下其他wiki使用此文件:
- cs.wikipedia.org上的用途
- da.wikipedia.org上的用途
- en.wikipedia.org上的用途
- es.wikipedia.org上的用途
- et.wikipedia.org上的用途
- hy.wikipedia.org上的用途
- ms.wikipedia.org上的用途
- nl.wikipedia.org上的用途
- no.wikipedia.org上的用途
- sv.wikipedia.org上的用途
- tr.wikipedia.org上的用途
- uz.wikipedia.org上的用途
- vi.wikipedia.org上的用途
元数据
🔥 Top keywords: Baike: 首页Special:搜索毛泽东家族榮耀之繼承者天之驕女鐵拳英雄九龍城寨之圍城黃循財背着善宰跑篠崎泫妮妃雅新生 (网络剧)劉偉健斯洛伐克习近平劉俊謙 (香港)李显龙歌手2024佛誕淚之女王2024年泰國羽球公開賽新加坡總理邊佑錫新加坡Energy (組合)庆余年九龍寨城六四事件家族榮耀金智媛彌助菲律宾胖猫跳江事件劉寶傑DAY6林峯張文傑李光耀神耆小子張鳳妮黃世聰Seventeen (組合)维基百科願榮光歸香港中華民國鬼滅之刃 柱訓練篇2024年英雄联盟季中邀请赛中华人民共和国TripleS金秀賢 (男演員)罗伯特·菲佐井柏然2024年世界女排联赛黃偉哲怪獸8號佘詩曼Foodpanda金惠奫新加坡总统香緹·摩爾于北辰 (1968年)王嘉爾笑看風雲排球少年!!角色列表林飛帆郭葦昀馴鹿寶貝翁靜晶猩球崛起:王國誕生ILLIT尼古拉·約基奇春色寄情人周殷廷鬼滅之刃排球少年!!吳釗燮逆天奇案2不夠善良的我們BABYMONSTER李正皓尚达曼BOYNEXTDOOR胡子彤IVE (組合)陳靜 (香港)香港吴作栋黃道十二宮凡希亚·奥伊亚胡宇威長洲太平清醮張員瑛搜查班長1958伍允龍习明泽黄岩岛賴清德偶然遇見的你虽然不是英雄