File:Spherical harmonics positive negative.svg

此SVG文件的PNG预览的大小:265 × 251像素。 其他分辨率:253 × 240像素 | 507 × 480像素 | 811 × 768像素 | 1,081 × 1,024像素 | 2,162 × 2,048像素。
原始文件 (SVG文件,尺寸为265 × 251像素,文件大小:22 KB)
摘要
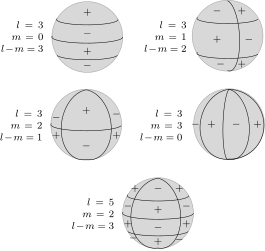
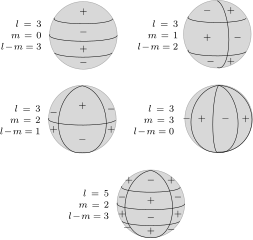
| 描述 | English: Representation of a spherical harmonic by discrepancy to a sphere. |
| 日期 | |
| 来源 | 自己的作品 |
| 作者 | Krishnavedala |
W3C-validity not checked.
| LaTeX source code |
|---|
\documentclass[12pt,border=1pt,tikz,class=scrartcl]{standalone}\usepackage[T1]{fontenc}\usepackage[utf8]{inputenc}\usepackage{lmodern}\usepackage{mathtools}\usepackage{tikz-3dplot}\usetikzlibrary{arrows,shapes,calc,positioning,matrix,fit}\begin{document}\scriptsize\tdplotsetmaincoords{100}{170}\begin{tikzpicture}[very thick,auto,info box/.style={align=right, text width=4em}]\node at (0,0) (p1) {\begin{tikzpicture}\draw[tdplot_screen_coords, fill=white!70!gray] (0,0) circle (1);\tdplotsinandcos {\sintheta}{\costheta}{0}\tdplotdrawarc {(0,0,-\sintheta)} {\costheta} {0} {-190} {} {} \tdplotsinandcos {\sintheta}{\costheta}{-30}\tdplotdrawarc {(0,0,-\sintheta)} {\costheta} {0} {-190} {} {} \tdplotsinandcos {\sintheta}{\costheta}{30}\tdplotdrawarc {(0,0,-\sintheta)} {\costheta} {-20} {-180} {} {} \node at (0,.7) {$+$};\node at (0,.1) {$-$};\node at (0,-.4) {$+$};\node at (0,-.8) {$-$};\end{tikzpicture}};\node [left=-.3em of p1,info box] {$l=3$\\$m=0$\\$l-m=3$};\node at (4,0) (p2) {\begin{tikzpicture}\draw[tdplot_screen_coords, fill=white!70!gray] (0,0) circle (1);\tdplotsinandcos {\sintheta}{\costheta}{-30}\tdplotdrawarc {(0,0,-\sintheta)} {\costheta} {0} {-180} {} {} \tdplotsinandcos {\sintheta}{\costheta}{30}\tdplotdrawarc {(0,0,-\sintheta)} {\costheta} {0} {-180} {} {} \tdplotsetthetaplanecoords{60}\tdplotdrawarc [tdplot_rotated_coords] {(0,0,0)} {1} {-180} {0} {} {}\node at (.4,.7) {$+$};\node at (-.3,.7) {$-$};\node at (.6,-.1) {$-$};\node at (-.3,-.1) {$+$};\node at (.4,-.8) {$+$};\node at (-.2,-.8) {$-$};\end{tikzpicture}};\node [left=-.3em of p2,info box] {$l=3$\\$m=1$\\$l-m=2$};\node at (0,-2.5) (p3) {\begin{tikzpicture}\draw[tdplot_screen_coords, fill=white!70!gray] (0,0) circle (1);\tdplotsinandcos {\sintheta}{\costheta}{0}\tdplotdrawarc {(0,0,-\sintheta)} {\costheta} {0} {-180} {} {} \tdplotsetthetaplanecoords{35}\tdplotdrawarc [tdplot_rotated_coords] {(0,0,0)} {1} {0} {-180} {} {} \tdplotsetthetaplanecoords{125}\tdplotdrawarc [tdplot_rotated_coords] {(0,0,0)} {1} {0} {-180} {} {} \node at (-.85,.2) {$-$};\node at (0,.4) {$+$};\node at (.85,.3) {$-$};\node at (-.85,-.3) {$+$};\node at (0,-.6) {$-$};\node at (.85,-.3) {$+$};\end{tikzpicture}};\node [left=-.3em of p3,info box] {$l=3$\\$m=2$\\$l-m=1$};\node at (4,-2.5) (p4) {\begin{tikzpicture}\draw[tdplot_screen_coords, fill=white!70!gray] (0,0) circle (1);\tdplotsetthetaplanecoords{0}\tdplotdrawarc [tdplot_rotated_coords] {(0,0,0)} {1} {0} {-180} {} {} \tdplotsetthetaplanecoords{45}\tdplotdrawarc [tdplot_rotated_coords] {(0,0,0)} {1} {0} {-180} {} {} \tdplotsetthetaplanecoords{90}\tdplotdrawarc [tdplot_rotated_coords] {(0,0,0)} {1} {0} {-180} {} {} \tdplotsetthetaplanecoords{135}\tdplotdrawarc [tdplot_rotated_coords] {(0,0,0)} {1} {0} {-180} {} {} \node at (-.95,0) {$-$};\node at (-.5,0) {$+$};\node at (.2,0) {$-$};\node at (.8,0) {$+$};\end{tikzpicture}};\node [left=-.3em of p4,info box] {$l=3$\\$m=3$\\$l-m=0$};\node at (2,-5) (p5) {\begin{tikzpicture}\draw[tdplot_screen_coords, fill=white!70!gray] (0,0) circle (1);\tdplotsinandcos {\sintheta}{\costheta}{0}\tdplotdrawarc {(0,0,-\sintheta)} {\costheta} {0} {-190} {} {} \tdplotsinandcos {\sintheta}{\costheta}{-30}\tdplotdrawarc {(0,0,-\sintheta)} {\costheta} {0} {-190} {} {} \tdplotsinandcos {\sintheta}{\costheta}{30}\tdplotdrawarc {(0,0,-\sintheta)} {\costheta} {-20} {-180} {} {} \tdplotsetthetaplanecoords{40}\tdplotdrawarc [tdplot_rotated_coords] {(0,0,0)} {1} {0} {-180} {} {} \tdplotsetthetaplanecoords{130}\tdplotdrawarc [tdplot_rotated_coords] {(0,0,0)} {1} {0} {-180} {} {} \node at (-.65,.7) {$+$};\node at (0,.7) {$-$};\node at (.6,.7) {$+$};\node at (-.85,.2) {$-$};\node at (0,.1) {$+$};\node at (.8,.2) {$-$};\node at (-.7,-.7) {$-$};\node at (0,-.8) {$+$};\node at (.6,-.75) {$-$};\node at (-.85,-.3) {$+$};\node at (0,-.4) {$-$};\node at (.8,-.3) {$+$};\end{tikzpicture}};\node [left=-.3em of p5,info box] {$l=5$\\$m=2$\\$l-m=3$};\end{tikzpicture}\end{document} |
许可协议
我,本作品著作权人,特此采用以下许可协议发表本作品:
本文件采用知识共享署名-相同方式共享 4.0 国际许可协议授权。
- 您可以自由地:
- 共享 – 复制、发行并传播本作品
- 修改 – 改编作品
- 惟须遵守下列条件:
- 署名 – 您必须对作品进行署名,提供授权条款的链接,并说明是否对原始内容进行了更改。您可以用任何合理的方式来署名,但不得以任何方式表明许可人认可您或您的使用。
- 相同方式共享 – 如果您再混合、转换或者基于本作品进行创作,您必须以与原先许可协议相同或相兼容的许可协议分发您贡献的作品。
文件历史
点击某个日期/时间查看对应时刻的文件。
| 日期/时间 | 缩略图 | 大小 | 用户 | 备注 | |
|---|---|---|---|---|---|
| 当前 | 2014年12月1日 (一) 23:43 | | 265 × 251(22 KB) | Krishnavedala | User created page with UploadWizard |
文件用途
以下页面使用本文件:
全域文件用途
以下其他wiki使用此文件:
- de.wikipedia.org上的用途
- en.wikipedia.org上的用途
- pt.wikipedia.org上的用途
- tr.wikipedia.org上的用途
- vi.wikipedia.org上的用途
元数据
🔥 Top keywords: Baike: 首页Special:搜索胖猫跳江事件背着善宰跑九龍城寨之圍城逆天奇案2璩静淚之女王歌手2024Energy (組合)新生 (网络剧)习近平匈牙利邊佑錫劉俊謙 (香港)金智媛神耆小子塞尔维亚金秀賢 (男演員)母亲节猩球崛起:王國誕生九龍寨城馴鹿寶貝家族榮耀之繼承者Seventeen (組合)六四事件不夠善良的我們张维为楊佩潔TripleS支配物种庆余年郭葦昀洪若潭命案金惠奫2024年英雄联盟季中邀请赛春色寄情人BABYMONSTER笑看風雲乘風2024排球少年!!角色列表破墓徐巧芯中华人民共和国中華民國打天下2WIND BREAKER—防風少年—习明泽排球少年!!彭丽媛磁暴ILLIT贾斯汀·比伯逆天奇案BOYNEXTDOOR猿人爭霸戰:猩凶革命張書偉我的婆婆怎麼那麼可愛我獨自升級怪獸8號謝坤達IVE (組合)與鳳行關於我轉生變成史萊姆這檔事角色列表黃道十二宮福建號航空母艦虽然不是英雄葉乃文五月天張員瑛草榴社区張文傑2024年花蓮地震极光香緹·摩爾迷宮飯呂家愷搜查班長1958日本劉德華海莉·鮑德溫蕭景鴻越位 (足球)葬送的芙莉蓮周處除三害 (電影)毛泽东願榮光歸香港林峯周雨彤伍允龍羅毓儀香港Baike: 分類索引沒有秘密猩球崛起:終極決戰角質層唐振剛柯佳嬿文化大革命