File:Population curve.svg

此SVG文件的PNG预览的大小:547 × 332像素。 其他分辨率:320 × 194像素 | 640 × 388像素 | 1,024 × 622像素 | 1,280 × 777像素 | 2,560 × 1,554像素。
原始文件 (SVG文件,尺寸为547 × 332像素,文件大小:10 KB)
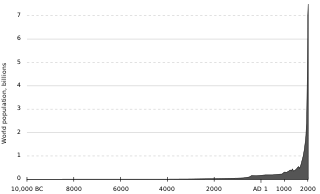
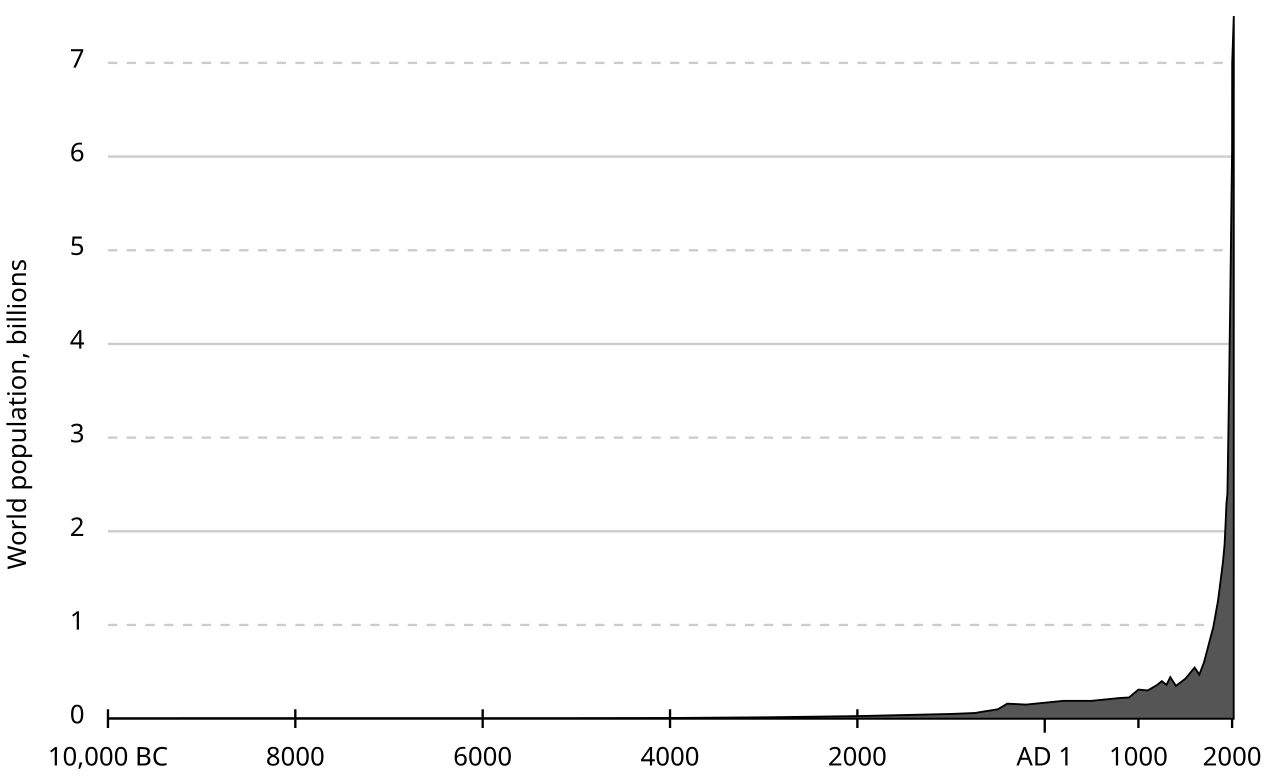
| 描述 | World human population (est.) 10,000 BC–2000 AD. |
| 来源 | originally uploaded to en.wikipedia as Population curve.svg. The data is from the "lower" estimates at census.gov (archive.org mirror). |
| 作者 | El T |
| 其他版本 | File:Population curve-ar.svg |
| 本作品已被作者英语维基百科的El T释出到公有领域。这适用于全世界。 在一些国家这可能不合法;如果是这样的话,那么: El T无条件地授予任何人以任何目的使用本作品的权利,除非这些条件是法律规定所必需的。 |
Data
year world population (millions)-10000 4-8000 5-7000 5-6000 5-5000 5-4000 7-3000 14-2000 27-1000 50-750 60-500 100-400 160-200 1501 170200 190400 190500 190600 200700 210800 220900 2261000 3101100 3011200 3601250 4001300 3601340 4431400 3501500 4251600 5451650 4701700 6001750 7901800 9801850 12601900 16501910 17501920 18601930 20701940 23001950 24001960 30201970 37001974 40001980 44301987 50001990 52602000 60702000 6500 (July 2)*2000 6747.5 (October 2)*2001 7000 (March 15)*2001 7000.025 (April 21)**) Data points as actually plotted in 2012-05-24 revision (exact X axis values are 2000.5, 2000.75, 2001.2 and 2001.3) These are probably incorrect.
Sources
- Biraben, Jean-Noel, 1980, An Essay Concerning Mankind's Evolution, Population, Selected Papers, December, table 2.
- Durand, John D., 1974, "Historical Estimates of World Population: An Evaluation," University of Pennsylvania, Population Center, Analytical and Technical Reports, Number 10, table 2.
- Haub, Carl, 1995, "How Many People Have Ever Lived on Earth?" Population Today, February, p. 5.
- McEvedy, Colin and Richard Jones, 1978, "Atlas of World Population History," Facts on File, New York, pp. 342-351.
- Thomlinson, Ralph, 1975, "Demographic Problems, Controversy Over Population Control," Second Edition, Table 1.
- United Nations (UN), 1973, The Determinants and Consequences ofPopulation Trends, Population Studies, No. 50., p.10.
- United Nations, 1999, The World at Six Billion, Table 1, "World Population From" Year 0 to Stabilization, p. 5, http://www.un.org/esa/population/publications/sixbillion/sixbilpart1.pdf
- U.S. Census Bureau (USCB), 2008, "Total Midyear Population for the World: 1950-2050", Data updated 12-15-2008, https://www.census.gov\/ipc/www/idb/worldpop.html
文件历史
点击某个日期/时间查看对应时刻的文件。
| 日期/时间 | 缩略图 | 大小 | 用户 | 备注 | |
|---|---|---|---|---|---|
| 当前 | 2017年8月15日 (二) 22:24 | | 547 × 332(10 KB) | Gregor Hagedorn | Updating to 2017/7.5 billion |
| 2015年7月21日 (二) 09:25 |  | 550 × 325(10 KB) | JorisvS | Reverted to version as of 12:45, 24 May 2012: It breaks the text and numbers in the graph | |
| 2015年5月20日 (三) 18:44 |  | 2,500 × 1,478(15 KB) | GregKaye | moving to bronze age time scale | |
| 2012年5月24日 (四) 12:45 |  | 550 × 325(10 KB) | Spesh531 | Adding up to 7 billion, a year is .004 pixels | |
| 2006年11月10日 (五) 10:56 |  | 550 × 275(4 KB) | Dangauthier |
文件用途
全域文件用途
以下其他wiki使用此文件:
- af.wikipedia.org上的用途
- ar.wikipedia.org上的用途
- ast.wikipedia.org上的用途
- az.wikipedia.org上的用途
- be.wikipedia.org上的用途
- bg.wikipedia.org上的用途
- bn.wikipedia.org上的用途
- ca.wikipedia.org上的用途
- cs.wikipedia.org上的用途
- cs.wikinews.org上的用途
- da.wikipedia.org上的用途
- da.wikibooks.org上的用途
- de.wikipedia.org上的用途
- el.wikipedia.org上的用途
- en.wikipedia.org上的用途
- The Population Bomb
- I = PAT
- Demographic transition
- Paul R. Ehrlich
- Doomsday argument
- Environmental degradation
- Population growth
- Human impact on the environment
- Intraspecific competition
- Albert Allen Bartlett
- Andrey Korotayev
- Baike: Reference desk/Archives/Humanities/2006 September 4
- Baike: Reference desk/Archives/Miscellaneous/2006 October 2
- Estimates of historical world population
- Baike: Graphics Lab/Images to improve/Archive/Mar 2008
- World population
- Talk:World population/Archive 1
- User talk:McSly/Archive 1
- User:Bigmadrich/sandbox
- User:I worship oil
- en.wikibooks.org上的用途
- en.wiktionary.org上的用途
- eo.wikipedia.org上的用途
查看本文件的更多全域用途。
元数据
🔥 Top keywords: Baike: 首页Special:搜索胖猫跳江事件背着善宰跑九龍城寨之圍城逆天奇案2璩静淚之女王歌手2024Energy (組合)新生 (网络剧)习近平匈牙利邊佑錫劉俊謙 (香港)金智媛神耆小子塞尔维亚金秀賢 (男演員)母亲节猩球崛起:王國誕生九龍寨城馴鹿寶貝家族榮耀之繼承者Seventeen (組合)六四事件不夠善良的我們张维为楊佩潔TripleS支配物种庆余年郭葦昀洪若潭命案金惠奫2024年英雄联盟季中邀请赛春色寄情人BABYMONSTER笑看風雲乘風2024排球少年!!角色列表破墓徐巧芯中华人民共和国中華民國打天下2WIND BREAKER—防風少年—习明泽排球少年!!彭丽媛磁暴ILLIT贾斯汀·比伯逆天奇案BOYNEXTDOOR猿人爭霸戰:猩凶革命張書偉我的婆婆怎麼那麼可愛我獨自升級怪獸8號謝坤達IVE (組合)與鳳行關於我轉生變成史萊姆這檔事角色列表黃道十二宮福建號航空母艦虽然不是英雄葉乃文五月天張員瑛草榴社区張文傑2024年花蓮地震极光香緹·摩爾迷宮飯呂家愷搜查班長1958日本劉德華海莉·鮑德溫蕭景鴻越位 (足球)葬送的芙莉蓮周處除三害 (電影)毛泽东願榮光歸香港林峯周雨彤伍允龍羅毓儀香港Baike: 分類索引沒有秘密猩球崛起:終極決戰角質層唐振剛柯佳嬿文化大革命