File:Piecewise linear function2D.svg

此SVG文件的PNG预览的大小:443 × 443像素。 其他分辨率:240 × 240像素 | 480 × 480像素 | 768 × 768像素 | 1,024 × 1,024像素 | 2,048 × 2,048像素。
原始文件 (SVG文件,尺寸为443 × 443像素,文件大小:60 KB)
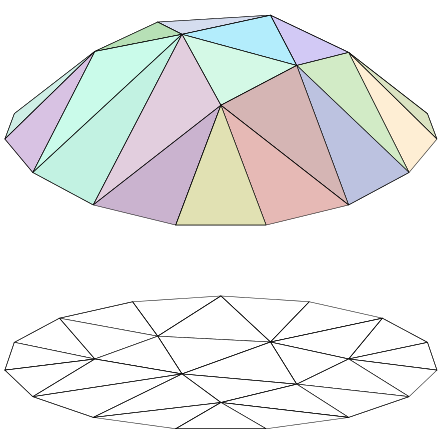
| 描述 | Illustration of a en:piecewise linear function |
| 日期 | (UTC) |
| 来源 | self-made, with en:MATLAB. |
| 作者 | Oleg Alexandrov |
| 我,本作品著作权人,释出本作品至公有领域。这适用于全世界。 在一些国家这可能不合法;如果是这样的话,那么: 我无条件地授予任何人以任何目的使用本作品的权利,除非这些条件是法律规定所必需的。 |
Source code (MATLAB)
% Draw a piewise-linear function in two dimensions on a given triangulation.% Due to a bug in plot2svg, it can't export 3D pictures well.% Then, I have to take the 3D picture, and rotate and project it manually to 2D.% That makes the code more complicated.function main()% read the triangulation from the data at the end of the code dummy_arg = 0; node=get_nodes(dummy_arg); [np, k]=size(node); ele=get_triangles(dummy_arg); [nt, k]=size(ele); % the function whose piecewise-linear approximation will be graphed f=inline('0.07*(22-8*x^2-10*y^2)+0.14'); % will keep here the triangles to plot and their colors P = zeros(3*nt, 3); C = zeros(nt, 3); % iterate through triangles, save the coordinates of all the triangles alpha=0.3; for i=1:nt; u=ele(i,2); v=ele(i, 3); w=ele(i, 4); y1=node(u, 2); x1=node(u, 3); f1=f(x1, y1); y2=node(v, 2); x2=node(v, 3); f2=f(x2, y2); y3=node(w, 2); x3=node(w, 3); f3=f(x3, y3); % the color of the given triangle is chosen randomly color = alpha*rand(1, 3)+(1-alpha)*[1 1 1]; % store the triangle and its color for the future m = 3*i - 2; P(m+0, 1) = x1; P(m+0, 2) = y1; P(m+0, 3) = f1; P(m+1, 1) = x2; P(m+1, 2) = y2; P(m+1, 3) = f2; P(m+2, 1) = x3; P(m+2, 2) = y3; P(m+2, 3) = f3; C(i, :) = color; end% the "base", the domain of the piecewise linear function P0 = P; P0(:, 3) = 0*P0(:, 3);% Do a rotation in 3D, then plot the projections onto the xy-plane.% This has to be done by hand since plot2svg has trouble saving 3D graphics a = pi/2.5; b = 0; c = 0; Q = do_rotate(P, a, b, c); Q0 = do_rotate(P0, a, b, c); % sort the triangles by the third coordinate of the center of gravity (after the rotation) R = zeros(nt, 2); for i=1:nt m = 3*i-2; z1=Q(m, 3); z2=Q(m+1, 3); z3=Q(m+2, 3); R(i, 1) = (z1+z2+z3)/3; R(i, 2) = i; end R = sortrows(R, 1); % plot the projection of the rotated figure and the base shape clf; hold on; axis equal; axis off; lw = 0.5; black = [0, 0, 0]; white = [1, 1, 1]; for i = 1:nt j = R(i, 2); m = 3*j-2; fill([Q(m, 1), Q(m+1, 1) Q(m+2, 1)], [Q(m, 2), Q(m+1, 2) Q(m+2, 2)], C(i, :)); fill([Q0(m, 1), Q0(m+1, 1) Q0(m+2, 1)], [Q0(m, 2), Q0(m+1, 2) Q0(m+2, 2)], white); plot([Q(m, 1), Q(m+1, 1) Q(m+2, 1), Q(m, 1)], [Q(m, 2), Q(m+1, 2) Q(m+2, 2), Q(m, 2)], ... 'linewidth', lw, 'color', black); plot([Q0(m, 1), Q0(m+1, 1) Q0(m+2, 1), Q0(m, 1)], [Q0(m, 2), Q0(m+1, 2) Q0(m+2, 2), Q0(m, 2)], ... 'linewidth', lw, 'color', black); end % a small fix to avoid a bug with the bounding box when exporting small = 0.1; Sx = min(min(Q(:, 1)), min(Q0(:, 1)))-small; Lx = max(max(Q(:, 1)), max(Q0(:, 1)))+small; Sy = min(min(Q(:, 2)), min(Q0(:, 2)))-small; Ly = max(max(Q(:, 2)), max(Q0(:, 2)))+small; plot(Lx, Ly, '*', 'color', 0.99*white); plot(Sx, Sy, '*', 'color', 0.99*white); axis([Sx-small Lx+small, Sy-small, Ly+small])% export as eps and svg% saveas(gcf, 'piecewise_linear2D_proj.eps', 'psc2') plot2svg('piecewise_linear2D_proj.svg') function node = get_nodes (dummy_arg) node =[1 1 02 0.913545 0.4067373 0.669131 0.7431454 0.309017 0.9510575 -0.104528 0.9945226 -0.5 0.8660257 -0.809017 0.5877858 -0.978148 0.2079129 -0.978148 -0.20791210 -0.809017 -0.58778511 -0.5 -0.86602512 -0.104528 -0.99452213 0.309017 -0.95105714 0.669131 -0.74314515 0.913545 -0.40673716 -0.161265 -0.17910317 0.313878 0.22804618 -0.314083 0.34882519 0.40037 -0.29088620 0.0609951 -0.5803321 0.0617879 0.58787322 -0.587046 1.34875e-16]; function ele = get_triangles(dummy_arg) ele=[1 10 11 162 16 18 223 10 22 94 10 16 225 11 12 206 7 22 187 21 3 48 8 9 229 8 22 710 1 19 1511 20 13 1412 6 18 2113 6 21 514 19 1 1715 19 16 2016 11 20 1617 2 17 118 16 17 1819 6 7 1820 17 16 1921 21 4 522 3 17 223 17 3 2124 20 12 1325 19 20 1426 18 17 2127 14 15 19];function Q = do_rotate(P, a, b, c) M = [1, 0, 0; 0, cos(a), sin(a); 0 -sin(a), cos(a)]*[cos(b), 0, -sin(b); 0, 1, 0; sin(b), 0, cos(b)]... *[cos(c), sin(c), 0; -sin(c), cos(c), 0; 0, 0, 1]; [m, n] = size(P); Q = 0*P; for i=1:m X = P(i, :)'; X = M*X; Q(i, 1) = X(1); Q(i, 2) = X(2); Q(i, 3) = X(3); end文件历史
点击某个日期/时间查看对应时刻的文件。
| 日期/时间 | 缩略图 | 大小 | 用户 | 备注 | |
|---|---|---|---|---|---|
| 当前 | 2007年7月18日 (三) 00:13 | | 443 × 443(60 KB) | Oleg Alexandrov | tweak |
| 2007年6月19日 (二) 02:39 |  | 443 × 443(38 KB) | Oleg Alexandrov | tweak | |
| 2007年6月19日 (二) 02:24 |  | 426 × 426(38 KB) | Oleg Alexandrov | {{Information |Description=Illustration of a en:piecewise linear function |Source=self-made, with en:MATLAB. |Date= ~~~~~ |Author= Oleg Alexandrov }} {{PD-self}} |
文件用途
以下页面使用本文件:
全域文件用途
以下其他wiki使用此文件:
- ar.wikipedia.org上的用途
- ca.wikipedia.org上的用途
- de.wikipedia.org上的用途
- de.wikiversity.org上的用途
- en.wikipedia.org上的用途
- es.wikipedia.org上的用途
- fi.wikipedia.org上的用途
- fr.wikipedia.org上的用途
- he.wikipedia.org上的用途
- hi.wikipedia.org上的用途
- ja.wikipedia.org上的用途
- pl.wikipedia.org上的用途
- pt.wikipedia.org上的用途
- sr.wikipedia.org上的用途
- ta.wikipedia.org上的用途
- tr.wikipedia.org上的用途
- uk.wikipedia.org上的用途
🔥 Top keywords: Baike: 首页Special:搜索毛泽东家族榮耀之繼承者天之驕女鐵拳英雄九龍城寨之圍城黃循財背着善宰跑篠崎泫妮妃雅新生 (网络剧)劉偉健斯洛伐克习近平劉俊謙 (香港)李显龙歌手2024佛誕淚之女王2024年泰國羽球公開賽新加坡總理邊佑錫新加坡Energy (組合)庆余年九龍寨城六四事件家族榮耀金智媛彌助菲律宾胖猫跳江事件劉寶傑DAY6林峯張文傑李光耀神耆小子張鳳妮黃世聰Seventeen (組合)维基百科願榮光歸香港中華民國鬼滅之刃 柱訓練篇2024年英雄联盟季中邀请赛中华人民共和国TripleS金秀賢 (男演員)罗伯特·菲佐井柏然2024年世界女排联赛黃偉哲怪獸8號佘詩曼Foodpanda金惠奫新加坡总统香緹·摩爾于北辰 (1968年)王嘉爾笑看風雲排球少年!!角色列表林飛帆郭葦昀馴鹿寶貝翁靜晶猩球崛起:王國誕生ILLIT尼古拉·約基奇春色寄情人周殷廷鬼滅之刃排球少年!!吳釗燮逆天奇案2不夠善良的我們BABYMONSTER李正皓尚达曼BOYNEXTDOOR胡子彤IVE (組合)陳靜 (香港)香港吴作栋黃道十二宮凡希亚·奥伊亚胡宇威長洲太平清醮張員瑛搜查班長1958伍允龍习明泽黄岩岛賴清德偶然遇見的你虽然不是英雄