File:Navier Stokes Laminar.svg

原始文件(SVG文件,尺寸为900 × 720像素,文件大小:9.37 MB)


摘要

描述
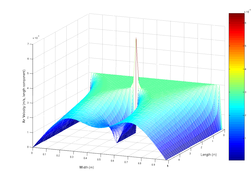
English: SVG illustration of the classic Navier-Stokes obstructed duct problem, which is stated as follows. There is air flowing in the 2-dimensional rectangular duct. In the middle of the duct, there is a point obstructing the flow. We may leverage Navier-Stokes equation to simulate the air velocity at each point within the duct. This plot gives the air velocity component of the direction along the duct. One may refer to [1], in which Eq. (3) is a little simplified version compared with ours.
日期
来源

自己的作品

Brief description of the numerical method

The following code leverages some numerical methods to simulate the solution of the 2-dimensional Navier-Stokes equation.

We choose the simplified incompressible flow Navier-Stokes Equation as follows:

The iterations here are based on the velocity change rate, which is given by

Or in X coordinates:

The above equation gives the code. The case of Y is similar.
作者IkamusumeFan
其他版本
SVG开发
InfoField
SVG的源代码为有效代码
矢量图使用Matplotlib创作。
源代码
InfoField

Python code

from __future__ import divisionfrom numpy import arange, meshgrid, sqrt, zeros, sumimport matplotlib.pyplot as pltfrom mpl_toolkits.mplot3d import Axes3Dfrom matplotlib.ticker import ScalarFormatterfrom matplotlib import rcParams rcParams['font.family'] = 'serif'rcParams['font.size'] = 16 # the layout of the duct laminarx_max = 5 # duct lengthy_max = 1 # duct width# draw the frames, including the angles and labelsax = Axes3D(plt.figure(figsize=(10, 8)), azim=20, elev=20)ax.set_xlabel(r"$x$", fontsize=20)ax.set_ylabel(r"$y$", fontsize=20)ax.zaxis.set_rotate_label(False)ax.set_zlabel(r"$v_x$", fontsize=20, rotation='horizontal')formatter = ScalarFormatter(useMathText=True)formatter = ScalarFormatter()formatter.set_scientific(True)formatter.set_powerlimits((-2,2))ax.w_zaxis.set_major_formatter(formatter)ax.set_xlim([0, x_max])ax.set_ylim([0, y_max])# initial speed of the airini_v = 3e-3mu = 1e-5rho = 1.3# the acceptable difference when terminationaccept_diff = 1e-5# time intervaltime_delta = 1.0# coordinate intervaldelta = 1e-2;X = arange(0, x_max + delta, delta)Y = arange(0, y_max + delta, delta)# number of coordinate pointsx_size = len(X) - 1y_size = len(Y) - 1Vx = zeros((len(X), len(Y)))Vy = zeros((len(X), len(Y)))new_Vx = zeros((len(X), len(Y)))new_Vy = zeros((len(X), len(Y)))# initial conditionsVx[1: x_size - 1, 2:y_size - 1] = ini_v# start evolution and computationres = 1 + accept_diffrounds = 0alpha = mu/(rho * delta**2)while (res>accept_diff and rounds<100):    """    The iterations here are based on the velocity change rate, which    is given by        \frac{\partial v}{\partial t} = \alpha\nabla^2 v - v \cdot \nabla v        with \alpha = \mu/\rho.    """    new_Vx[2:-2, 2:-2] = Vx[2:-2, 2:-2] +  time_delta*(alpha*(Vx[3:-1, 2:-2] +        Vx[2:-2, 3:-1] - 4*Vx[2:-2, 2:-2] + Vx[2:-2, 1:-3] + Vx[1:-3, 2:-2]) -        0.5/delta * (Vx[2:-2, 2:-2] * (Vx[3:-1, 2:-2] - Vx[1:-3, 2:-2]) +        Vy[2:-2, 2:-2]*(Vx[2:-2, 3:-1] - Vx[2:-2, 1:-3])))    new_Vy[2:-2, 2:-2] = Vy[2:-2, 2:-2] + time_delta*(alpha*(Vy[3:-1, 2:-2] +        Vy[2:-2, 3:-1] - 4*Vy[2:-2, 2:-2] + Vy[2:-2, 1:-3] + Vy[1:-3, 2:-2]) -        0.5/delta * (Vy[2:-2, 2:-2] * (Vy[2:-2, 3:-1] - Vy[2:-2, 3:-1]) +        Vx[2:-2, 2:-2]*(Vy[3:-1, 2:-2] - Vy[1:-3, 2:-2])))            rounds = rounds + 1        # copy the new values    Vx[2:-2, 2:-2] = new_Vx[2:-2, 2:-2]    Vy[2:-2, 2:-2] = new_Vy[2:-2, 2:-2]    # set free boundary conditions: dv_x/dx = dv_y/dx = 0.    Vx[-1, 1:-1] = Vx[-3, 1:-1]    Vx[-2, 1:-1] = Vx[-3, 1:-1]    Vy[-1, 1:-1] = Vy[-3, 1:-1]    Vy[-2, 1:-1] = Vy[-3, 1:-1]    # there exists a still object in the plane    Vx[x_size//3:x_size//1.5, y_size//2.0] = 0    Vy[x_size//3:x_size//1.5, y_size//2.0] = 0    # calculate the residual of Vx    res = (Vx[3:-1, 2:-2] + Vx[2:-2, 3:-1] -           Vx[1:-3, 2:-2] - Vx[2:-2, 1:-3])**2    res = sum(res)/(4 * delta**2 * x_size * y_size)# prepare the plot dataZ = sqrt(Vx**2)# refine the region boundaryZ[0, 1:-2] = Z[1, 1:-2]Z[-2, 1:-2] = Z[-3, 1:-2]Z[-1, 1:-2] = Z[-3, 1:-2]Y, X = meshgrid(Y, X);ax.plot_surface(X, Y, Z, rstride=1, cstride=1, cmap="summer", lw=0.1,                edgecolors="k")plt.savefig("Navier_Stokes_Laminar.svg")

许可协议

我,本作品著作权人,特此采用以下许可协议发表本作品:
w:zh:知识共享
署名 相同方式共享
本文件采用知识共享署名-相同方式共享 4.0 国际许可协议授权。
您可以自由地:
  • 共享 – 复制、发行并传播本作品
  • 修改 – 改编作品
惟须遵守下列条件:
  • 署名 – 您必须对作品进行署名,提供授权条款的链接,并说明是否对原始内容进行了更改。您可以用任何合理的方式来署名,但不得以任何方式表明许可人认可您或您的使用。
  • 相同方式共享 – 如果您再混合、转换或者基于本作品进行创作,您必须以与原先许可协议相同或相兼容的许可协议分发您贡献的作品。
  1. Fan, Chien, and Bei-Tse Chao. "Unsteady, laminar, incompressible flow through rectangular ducts." Zeitschrift für angewandte Mathematik und Physik ZAMP 16, no. 3 (1965): 351-360.

说明

添加一行文字以描述该文件所表现的内容
project

此文件中描述的项目

描繪內容

文件历史

点击某个日期/时间查看对应时刻的文件。

日期/时间缩⁠略⁠图大小用户备注
当前2016年3月15日 (二) 01:062016年3月15日 (二) 01:06版本的缩略图900 × 720(9.37 MB)NicoguaroSmaller version
2016年3月15日 (二) 00:582016年3月15日 (二) 00:58版本的缩略图900 × 720(11.08 MB)NicoguaroChange the jet colormap, since it is recognized as a bad option, in general. Formatting, and pythonic code (and vectorized operations).
2014年11月6日 (四) 23:342014年11月6日 (四) 23:34版本的缩略图720 × 540(14.23 MB)IkamusumeFanUser created page with UploadWizard

全域文件用途

以下其他wiki使用此文件:

查看本文件的更多全域用途

元数据