File:NHC Atlantic Forecast Error Trends.png

本预览的尺寸:799 × 599像素。 其他分辨率:320 × 240像素 | 640 × 480像素 | 1,024 × 768像素 | 1,280 × 960像素 | 1,750 × 1,313像素。
原始文件 (1,750 × 1,313像素,文件大小:1.07 MB,MIME类型:image/png)
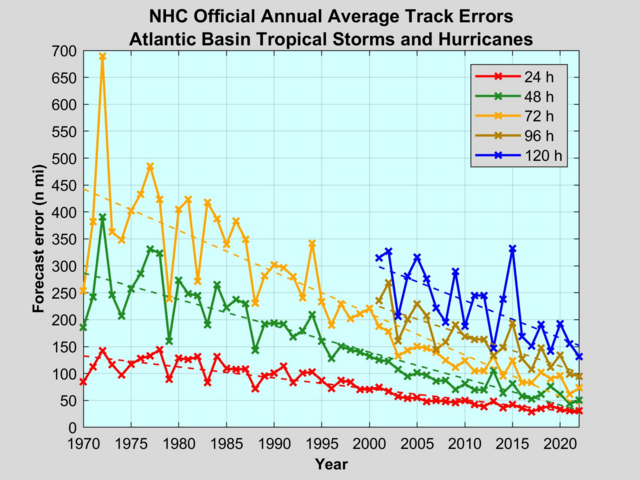
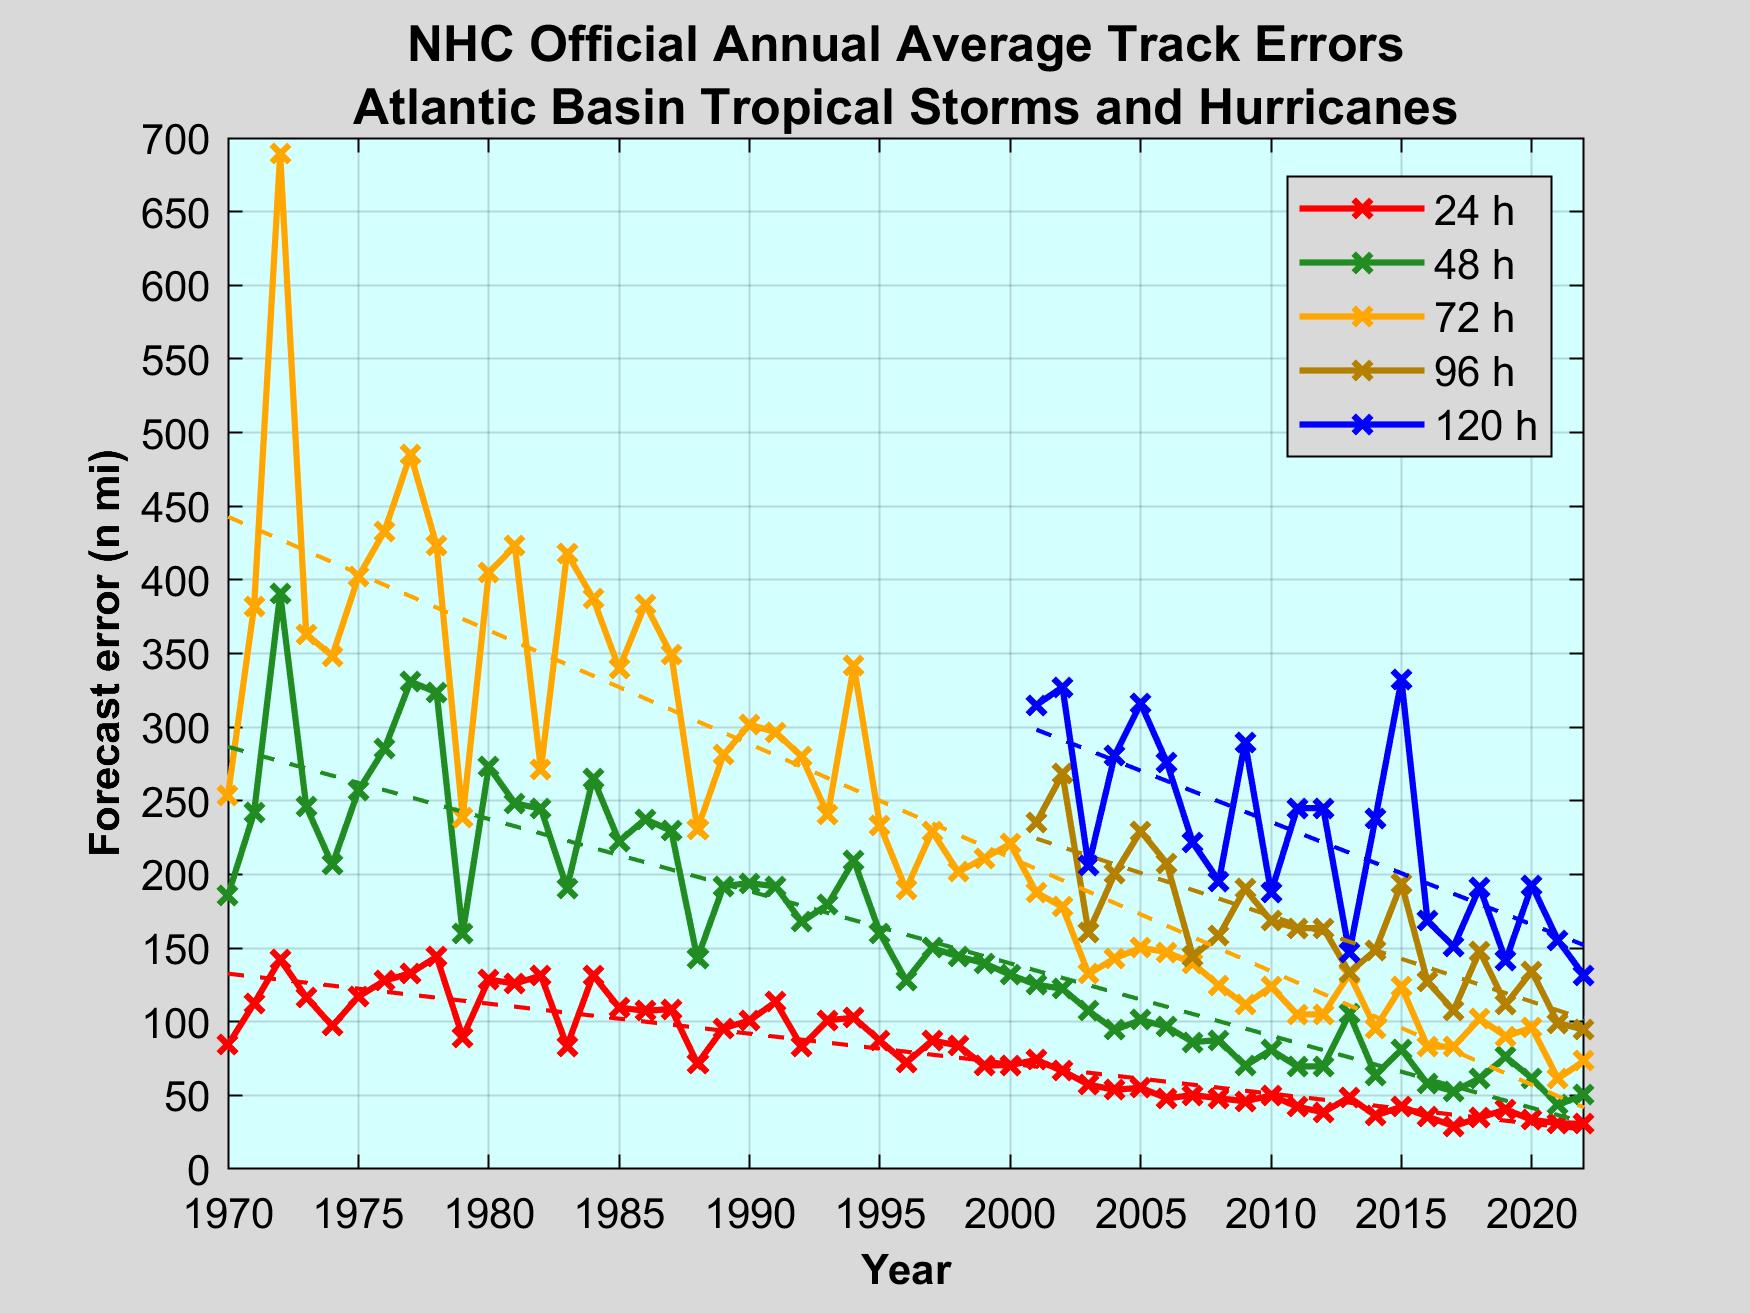
| 描述 | Error on the track since 1970 in Nautical miles. The different lines represent the forecasted position at different times prior to the verification (ex. 36h means the forecast made 36 h before the verification). |
| 日期 | (UTC) |
| 来源 | NOAA from National Hurricane Center Forecast Verification |
| 作者 | National Hurricane Center |
| 其他版本 | Image:NHC_Atlantic_Forecast_Error_Trends_FR.png |
 | 此graph图片可使用矢量图形重新创建为SVG文件。这具有很多好处;更多信息请参见共享资源:待清理媒体。如果存在此图片的SVG格式,请将其上传,然后将此模板替换为 {{vector version available|新图片名称}}。建议您将SVG命名为“NHC Atlantic Forecast Error Trends.svg”,这样在使用Vector version available(或Vva)模板时就不需要填写新图片名称参数。 |
本图像属于公有领域,因该作品最初来自于美国国家海洋和大气管理局职员的职务作品。 |
文件历史
点击某个日期/时间查看对应时刻的文件。
| 日期/时间 | 缩略图 | 大小 | 用户 | 备注 | |
|---|---|---|---|---|---|
| 当前 | 2021年3月17日 (三) 17:37 | | 1,750 × 1,313(1.07 MB) | Femke | Update to around 2019 |
| 2015年8月24日 (一) 21:35 |  | 2,400 × 1,800(1.85 MB) | Pierre cb | Updated data up to 2014 | |
| 2009年5月27日 (三) 03:25 |  | 1,210 × 950(46 KB) | Pierre cb | Updated data from 1970 to 2007 | |
| 2009年5月26日 (二) 13:40 |  | 1,210 × 950(28 KB) | Mahahahaneapneap | Compressed | |
| 2008年1月28日 (一) 03:21 |  | 1,210 × 950(57 KB) | Pierre cb | {{Information |Description=Errror on the track since 1970 in Nautical miles. |Source= [http://www.nhc.noaa.gov/verification/figs/Early_model_ATL_trk_error_trend.gif NOAA] |Date=~~~~~ |Author=~~~ |Permission= |other_versions=[[:Image:NHC_Atlantic_Forecast |
文件用途
以下页面使用本文件:
全域文件用途
以下其他wiki使用此文件:
- en.wikipedia.org上的用途
- hi.wikipedia.org上的用途
- pt.wikipedia.org上的用途
- ru.wikipedia.org上的用途
- simple.wikipedia.org上的用途
- th.wikipedia.org上的用途
元数据
🔥 Top keywords: Baike: 首页Special:搜索九龍城寨之圍城淚之女王2024年湯姆斯盃背着善宰跑不夠善良的我們安東尼·愛德華茲 (籃球運動員)金智媛2024年優霸盃胖猫跳江事件伍允龍金秀賢 (男演員)九龍寨城劉俊謙 (香港)怪獸8號春色寄情人汤姆斯杯虽然不是英雄Energy (組合)逆天奇案2习近平我的婆婆怎麼那麼可愛排球少年!!角色列表邊佑錫为人民服务 (2022年电影)Seventeen (組合)張文傑排球少年!!草蜢 (組合)2012搜查班長1958六四事件母亲节乘風2024破墓ILLITWIND BREAKER—防風少年—城市猎人 (2024年电影)支配物种與鳳行歐倩怡BOYNEXTDOOR鄧麗君达柳斯·莫里斯BABYMONSTER中华人民共和国承欢记中華民國胡子彤金惠奫城市猎人周處除三害 (電影)蔡一智蔡一傑郭晉安迷宮飯2024年英雄联盟季中邀请赛IVE (組合)沒有秘密蘇志威周雨彤尤伯杯五月天葬送的芙莉蓮哥吉拉-1.0許瑋甯草榴社区朴成焄日本千玗嬉香港(G)I-DLE林依晨李主儐李琳琳五四运动完全省錢戀愛手冊习明泽林峯鈴木亮平三流之路夜晚的水母不會游泳郭葦昀三体 (小说)李现幕府將軍 (2024年電視劇)白鹿 (演員)毛泽东張員瑛郑保瑞白紙運動立夏嚴爵星汉灿烂·月升沧海莊祖宜無職轉生~到了異世界就拿出真本事~THE NEW GATE張書偉